Lupine Publishers| Journal of Forensic and Genetics
Abstract
Keywords: Blood Alcohol Concentration; Neo formation; Head Space-Gas Chromatography; Ethanol.
Introduction
The reactions that take place are mainly influenced by temperature, pH value, concentrations of available carbohydrates, and the presence of other utilizable nutrients.
Pathway of Metabolism:
Fructose -1, 6 - bisphosphate ⇒ glyceraldehyde - 3 - phosphate ⇒ 3 - phosphoglycerate ⇒ 2 - phosphorglycerate ^ phosphoenolpyruvate ⇒ pyruvate ⇒ acetaldehyde Acetaldehyde + glyceraldehyde - 3 - phosphate + H2O ⇒ 3 - phosphoglycerate + ethanol.
Putrefaction or decomposition is the final stage produced mainly by the action of bacterial enzymes mostly anaerobic organisms. These destructive bacterial agents cause marked haemolysis, liquefaction of clots and fresh thrombi and emboli, disintegration of tissues and gas formation in blood. Bacteria produces a large variety of enzymes and these breakdown the various tissues of the body. There is a progressive alteration of proteins, carbohydrates and fats. Putrefaction begins mainly by reductive processes due to the action of endogenous and exogenous bacteria and their enzymes and decay, based on oxidative reactions. Body tissues remain bacteriological sterile from exogenous infection for at least 20 hours after death. Whereas advanced putrefaction of a blood sample can be recognized macroscopically and by its odour, the transitional phase into putrefaction presents difficulties. As the blood decomposes its coloring matter transducer into the tissues which become uniformly red. The colour becomes darker and finally turns black. The most abundant volatiles detected during the forensic ethanol analysis are ethanol, acetaldehyde, 1-propanol, 2-propanol and acetone. These volatiles could either be initiated in the human body after the consumption of alcoholic beverages; or have been produced later during metabolic processes or by microbes [4-7].
Alcohol concentration often changes in putrefying blood. These changes might be caused by either a change in the level of ethanol or to the formation of higher alcohols, aldehydes, and ketones. Even though "fresh" samples of blood can contain a variety of higher alcohols. Therefore, the presence of such alcohols must be a result of neo genesis within the corpse or the stored blood sample. Anticoagulants and preservatives for blood: Anticoagulant is a substance that prevents blood from clotting by suppressing the synthesis or function of various clotting factors. The first anticoagulant preservative was introduced by Rous and Turner in 1916. It consisted of a citrate-glucose solution in which blood from rabbits was stored for two weeks, which prevented anaemia when transfused in another rabbit who had suffered from blood loss. Some of the commonly used anticoagulants are:
a) EDTA: Ethylenediaminetetra acetic acid as disodium or potassium salts is used. This is a chelating agent which binds the calcium which is needed for coagulation. It is effective at a final concentration of 1 to 2 mg / ml of blood. More than 2 mg / ml causes shrinkage of the cells. This is the best anticoagulant for peripheral blood smear and studies. Drawbacks: It inhibits the activities of enzymes like alkaline phosphatase, creatine kinase, and leucine aminopeptidase. EDTA is not suitable for calcium and iron estimation.
b) Heparin: It is mucoitin polysulfuric acid available as sodium potassium, lithium and ammonium salts. Heparin accelerate the action of antithrombin III which neutralizes thrombin thus prevents the formation of fibrin from fibrinogen. Heparin is added 0.2 mg/ml of blood. Drawback: It inhibits the acid phosphates activity. It interferes with binding of calcium to EDTA.
c) Oxalate: This form insoluble complex with calcium ions. Potassium oxalate at concentration of 1 to 2 mg/ml of blood is used. Combination of ammonium/potassium oxalate does not lead to shrinkage of the RBCs. Drawbacks: If the concentration is 3 mg/ ml, then there are chances for hemolysis. Oxalates inhibit several enzymes like acid phosphates', alkaline phosphates, amylase, LDH, and may cause the precipitation of calcium as oxalate salt.
d) Sodium Fluoride: This is a weak anticoagulant but used antiglycolytic agent to preserve the glucose. This inhibits the system involved in glycolysis and preserves the glucose. This is effective at a concentration of 2 mg/ml of blood along with other anticoagulant like oxalate.
Drawback: This is also inhibitor of many enzymes and also effect urease for the estimation of urea
When blood is stored at 2-6 °C, glycosis is reduced but does not stop. Preservative solutions provide buffering capability to minimize pH changes and optimize the storage period. The lower temperature keeps the rate of glycolysis at lower limit and minimizes the proliferation of bacteria that might have entered the blood unit during venipuncture or from atmosphere. The rate of diffusion of electrolytes (Na+ and K+) across the cell membrane is also less at lower temperature.
b. Additive Solutions
One major benefit of the additive system is increase in the level of ATP, and red cells viability is enhanced, extending the shelf-life of the red cells to 42 days.
c. Health Care
Heavy drinking is a cause of ill-health and premature death. A person's blood alcohol concentration and state of inebriation at the time of death is not always easy to establish owing to various postmortem artifacts. The possibility of alcohol being produced in the body after death, e.g. via microbial contamination and fermentation is a recurring issue in routine casework. If ethanol remains unabsorbed in the stomach at the time of death, this raises the possibility of continued local diffusion into surrounding tissues and central blood after death. Blood samples, stored under insufficient conditions or for longer times and body fluids of corpses which had undergone putrefaction often contains certain amount of volatile compounds. This putrefactive alcohol is partly identifiably with congeners of alcoholic beverages. Such it is of Forensic relevance to discover post sampling ethanol neoformation and to discriminate putrefactive alcohols from fusel alcohols. Hence it cause on effect on person's health as it is stored blood but studies have revealed that few factors can change the results, such as amount of alcohol etc., so it is critical to decide the actual amount and this may also challenged by the legal system whether the person was under the influence of alcohol or not.
Aims and Objectives
-
a) To determine the volatile compounds in blood samples.
b) To study the effect of preservative and temperature on the formation and concentration of volatile compounds in blood samples.
c) To study the effect of storage time (duration of storage) on blood samples under controlled conditions.
Materials and Method
Three flasks were taken having human blood (60ml) in each flask. Chemical used:
-
a) Sodium fluoride (as preservative), this inhibit the system involved in glycolysis and preserve the glucose
b) N-propanol (for internal standard) standards are used by which can be relate the concentration of the standard to concentration of the peak of the ethanol. Samples were analyzed using instruments Head space-Gas Chromatography
Blood samples were divided into three conical flasks.
a) With 500mg sodium fluoride (preservative) at room temperature
b) Without preservative at room temperature
c) Without preservative at cold temperature.
Table 1: Showing parameters of Gas Chromatography.
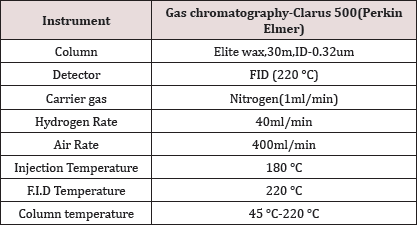
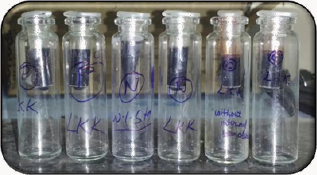
Figure 1: Showing preparation of samples..
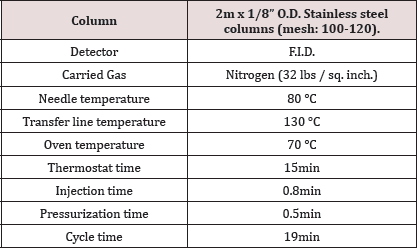
Headspace GC is used for the analysis of volatile and semi- volatile organics in solid, liquid and gas samples. The headspace method is especially suitable for the very fast separation of volatile components (alcohols, acetone, aldehydes) in complex biological matrices especially blood in mass-liquor and prohibition law related cases. This method has the advantage of avoiding the risk of contamination of non-volatile components, which may be eliminated due to on-line analysis by gas chromatography. The principle underlying the headspace analysis is that in a sealed vial at constant temperature, equilibrium is established between the volatile components of a liquid sample and the gas phase above it (the head space). After allowing the time for equilibrium a portion of the headspace may be withdrawn one by one from vials using a gas-tight syringe and injected to GC for on-line analysis (Table 2).
Table 2: Showing parameters of Head space.
Results and Discussion
influenced by temperature, pH value, concentrations of available carbohydrates, and the presence of other utilizable nutrients.
The main problems in the assessment of ethanol concentrations in blood from corpses include the potential of water loss, autolysis, putrefaction and postmortem glycogenolysis. A more precise differentiation of putrefactive alcohols has only been made possible by the introduction and development of gas chromatography. Comparing blood samples will recognize that the qualitative and quantitative; concentration of alcohols can be quite different. The possibility that neo genesis of ethanol after death might give rise to an incorrect estimation of BAC. In this study we examined the alcohol concentration qualitatively and quantitatively using head space-gas chromatography at the interval of successive seventh day from 16 Feb 2016 to 31 March 2016. The chromatogram of three different samples at different time periods is shown in following figures. Putrefaction of a blood sample was recognized by its odour and color. The predominating compound of alcohol formation in anaerobic putrefaction is ethanol. Additional formation of methanol, acetone and other alcohols occur only in trace amounts. But this study was only focused on the formation of Ethanol. The degradation of all alcohols however is assumed to commence within a few days. Peak values were measured after one week. It was found that the concentration of ethyl alcohol varies. After few weeks ethanol level decreases with increase in time of putrefactive blood and became almost constant. However no alcohol was detected at 4 °C. However, comparison of these graphs demonstrates that alcohol concentration often changes in putrefying blood. (Table 3) (Figure 2-12).
Figure 2: Showing quantitative chromatogram for the concentration of alcohol at day 1 in different samples.Day 1(16 Feb 2016)
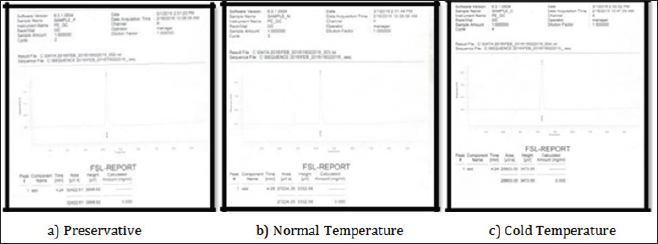
Figure 3: Showing quantitative chromatogram for the concentration of alcohol at day 2 in different samples.Day 2(23 Feb 2016)
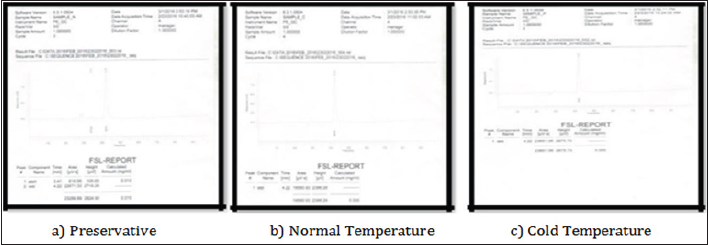
Figure 4: Showing qualitative chromatogram for the concentration of alcohol at day 3 in different samples.Day 3(1 March 2016)
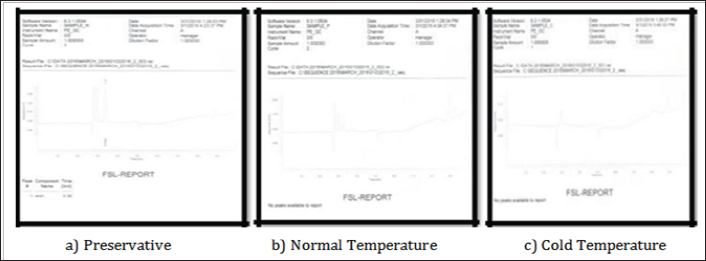
Figure 5: Showing quantitative chromatogram for the concentration of alcohol at day 3 in different samples.
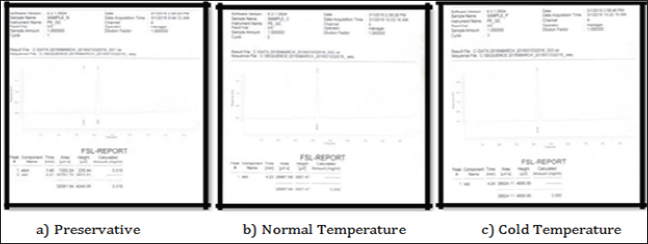
Figure 6: Showing qualitative chromatogram for the concentration of alcohol at day 4 in different samples.Day 4(8 March 2016)
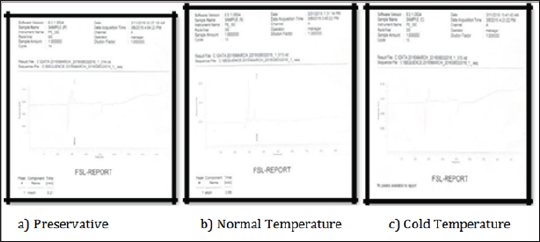
Figure 7: Showing quantitative chromatogram for the concentration of alcohol at day 4 in different samples.Day 5(15 March 2016)
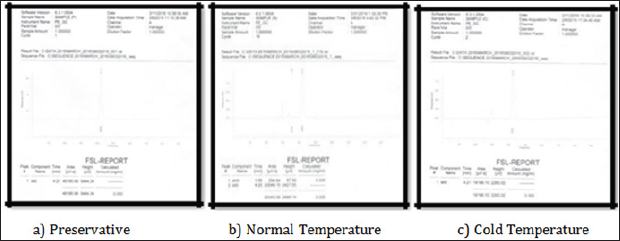
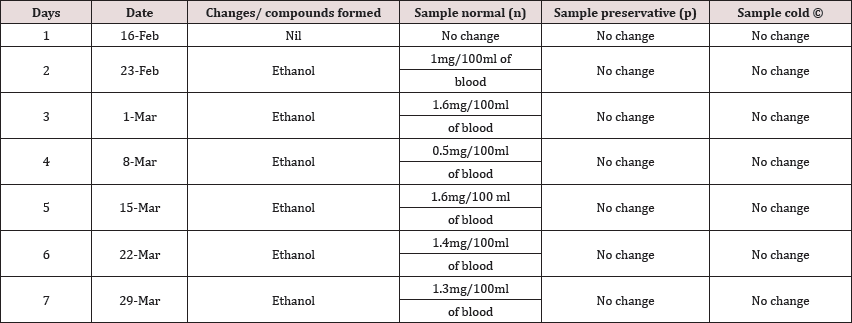
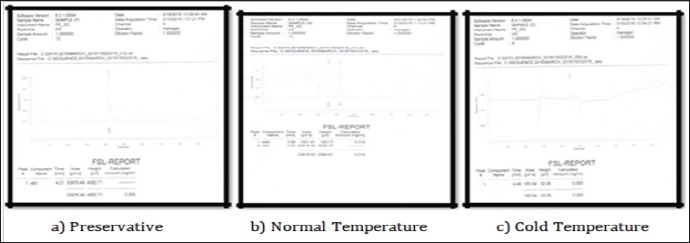
Figure 9: Showing qualitative chromatogram for the concentration of alcohol at day 6 in different samples.Day 6(22 March 2016)
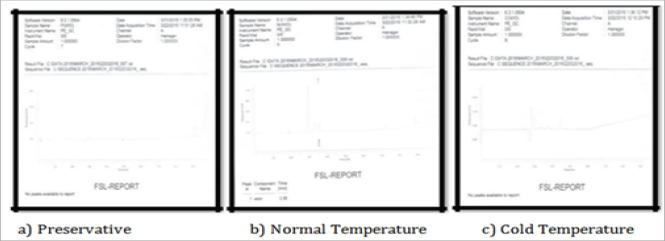
Figure 10: Showing quantitative chromatogram for the concentration of alcohol at day 6 in different sampl

Figure 11: Showing qualitative chromatogram for the concentration of alcohol at day 7 in different samples.DAY 7 (29 MARCH 2016)
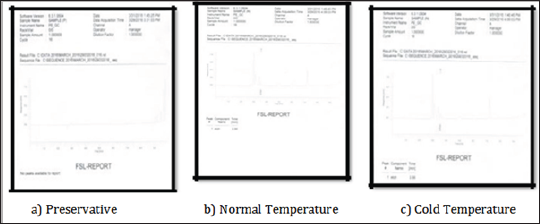
Figure 12: Showing quantitative chromatogram for the concentration of alcohol at day 7 in different samples.

Conclusion
Acknowledgement
For more Lupine Publishers please visit our website
For more Forensic and Genetic Sciences journals please click here
To know more about open access publishers please click on Lupine Publishers
Follow on Linkedin : https://www.linkedin.com/company/lupinepublishers
Follow on Twitter : https://twitter.com/lupine_online
Follow on Linkedin : https://www.linkedin.com/company/lupinepublishers
Follow on Twitter : https://twitter.com/lupine_online

No comments:
Post a Comment